Imagine measuring weight, distance, or income, where zero truly means “none of the quantity exists.” This is the power of a ratio scale: the most precise level of measurement in data analysis. Unlike other scales, it combines equal intervals with a true zero point, allowing you to say one value is twice or half another with complete mathematical validity. Whether you are analyzing sales data, interpreting maps, or running statistical models, understanding how a ratio scale works unlocks accurate comparisons and advanced calculations.
In this guide, you will learn what makes ratio scales unique, why the true zero is essential, and how to apply them across statistics, research, and cartography. You will discover real-world examples, supported operations, and common mistakes to avoid when working with ratio data.
True Zero Enables Proportional Comparisons
The defining feature of a ratio scale is its true zero, which represents the complete absence of the measured quantity. This is not merely symbolic. It is mathematical. Because zero means nothing, ratios between values are meaningful and interpretable.
Why Multiplication Only Works With True Zero
On a ratio scale, saying “10 kg is twice 5 kg” makes perfect sense because 0 kg means no mass at all. The same logic applies to time, money, and distance.
Consider these valid proportional statements:
- 60 seconds is four times 15 seconds.
- $80,000 income is double $40,000.
- 100 meters is five times 20 meters.
This logic fails on scales without true zero:
- 20°C is not twice as hot as 10°C, since 0°C does not mean “no temperature.”
- An IQ of 140 is not “twice as intelligent” as 70, because IQ has no natural zero.
Key Insight: Without a true zero, multiplication and division produce misleading results. Ratio scales avoid this by anchoring all values to an absolute baseline.
Recognizing Valid Ratio Statements
Ask yourself two questions: Does zero mean none? Can I form a meaningful ratio? If both answers are yes, the data is on a ratio scale.
Valid ratio statements include:
- “This phone costs three times more than that one.” (Price starts at $0)
- “She ran the race in half the time.” (Zero seconds means no duration)
- “We sold double last month’s units.” (Zero sales means no items sold)
Invalid statements include:
- “Today is twice as cold as yesterday.” (Temperature in °F or °C lacks true zero)
- “His pain level is half of hers.” (Pain scales are ordinal, not ratio)
Pro Tip: When designing surveys or choosing metrics, always verify whether your variable has a true zero before making proportional claims.
Distinguishing Ratio From Other Measurement Scales
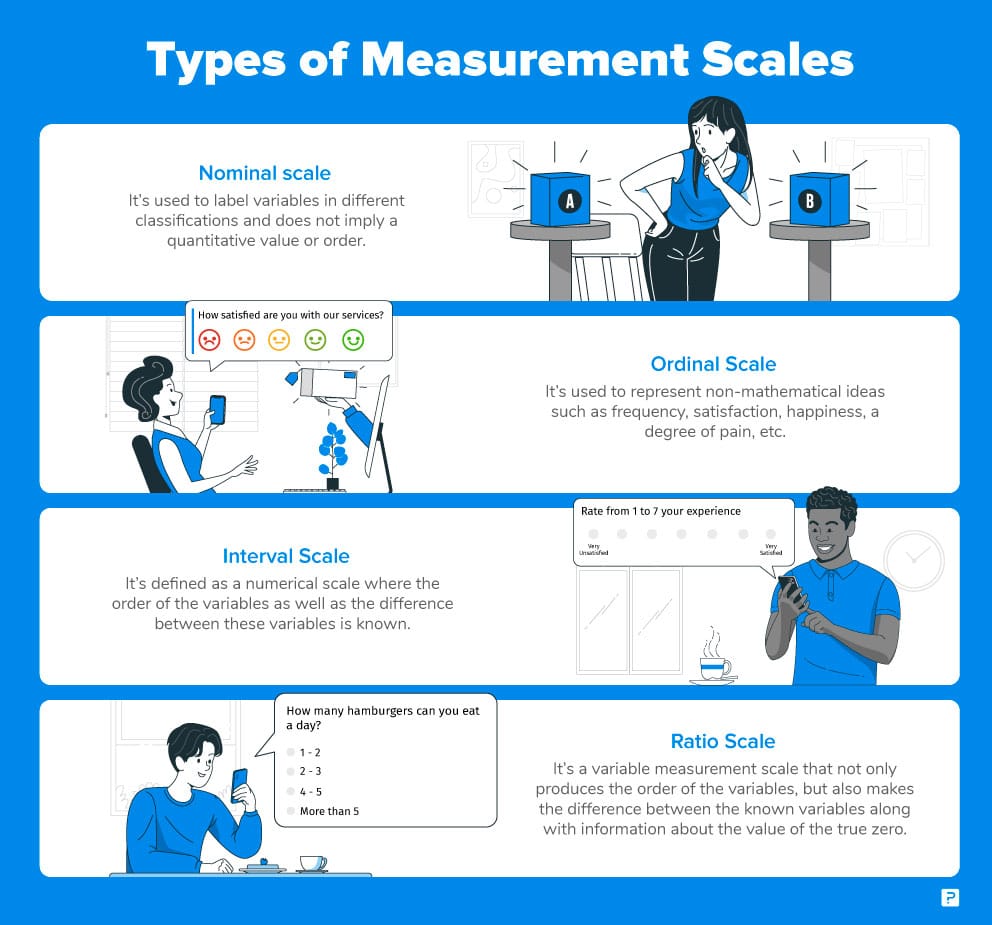
Not all numerical data is created equal. Confusing ratio with lower-level scales leads to flawed analysis. Understanding these distinctions is crucial for accurate data work.
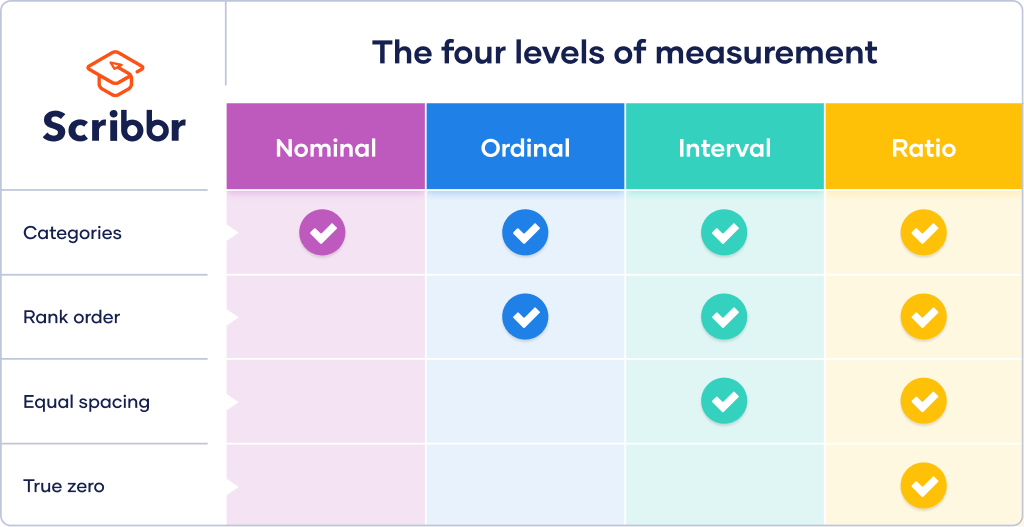
Compare the Four Measurement Levels
| Feature | Nominal | Ordinal | Interval | Ratio |
|---|---|---|---|---|
| Categories or labels | Yes | Yes | Yes | Yes |
| Order or rank | No | Yes | Yes | Yes |
| Equal intervals | No | No | Yes | Yes |
| True zero | No | No | No | Yes |
| Ratios allowed | No | No | No | Yes |
| Operations supported | Equality checks | Comparisons | Add, subtract | All four operations |
Only ratio scales support the full range of arithmetic operations, including multiplication and division.
Real Examples Showing the Differences
Temperature provides a clear illustration:
- Celsius (Interval): 0°C represents freezing water, not “no temperature.” Therefore, 20°C divided by 10°C does not equal twice as hot.
- Kelvin (Ratio): 0 K equals absolute zero, meaning no thermal energy exists. So 200 K is twice as hot as 100 K.
Income versus satisfaction shows another contrast:
- Income: $50,000 versus $25,000 has a true zero, making “twice as much” valid.
- Satisfaction: A rating of 4 out of 5 versus 2 out of 5 has an arbitrary zero, so “twice as satisfied” is meaningless.
Warning: Treating ordinal data (like Likert scales) as ratio inflates statistical accuracy and misleads conclusions.
Common Ratio Scale Variables and Their Uses
Ratio scales apply to any measurable quantity starting at zero and increasing in consistent units. These variables are foundational in science, business, and everyday decision-making.
Everyday Examples of Ratio Data
| Variable | Zero Meaning | Proportional Use |
|---|---|---|
| Age | Birth (0 years) | 40 is twice 20 |
| Weight | No mass (0 kg) | 90 kg equals 3 times 30 kg |
| Distance | No length (0 m) | 10 km equals 2 times 5 km |
| Time Duration | No elapsed time (0 sec) | 60 min equals 6 times 10 min |
| Revenue | No income ($0) | $2M equals 4 times $500K |
| Speed | No motion (0 mph) | 100 mph equals 2 times 50 mph |
| Customer Tenure | New customer (0 days) | 12 months equals 2 times 6 months |
Note: Ratio variables can be continuous (weight) or discrete (number of purchases).
Why Businesses Rely on Ratio Metrics
In marketing and analytics, ratio data powers key performance indicators:
- Customer Lifetime Value (CLV): Predicts future revenue per user.
- Conversion Rates: Tracks purchases per visit.
- Average Order Value (AOV): Compares spending across segments.
- Churn Rate: Measures lost customers over time.
Because these metrics have true zeros, companies can safely state: “Top 10% of users spend five times more than average.”
Performing Math Operations on Ratio Data
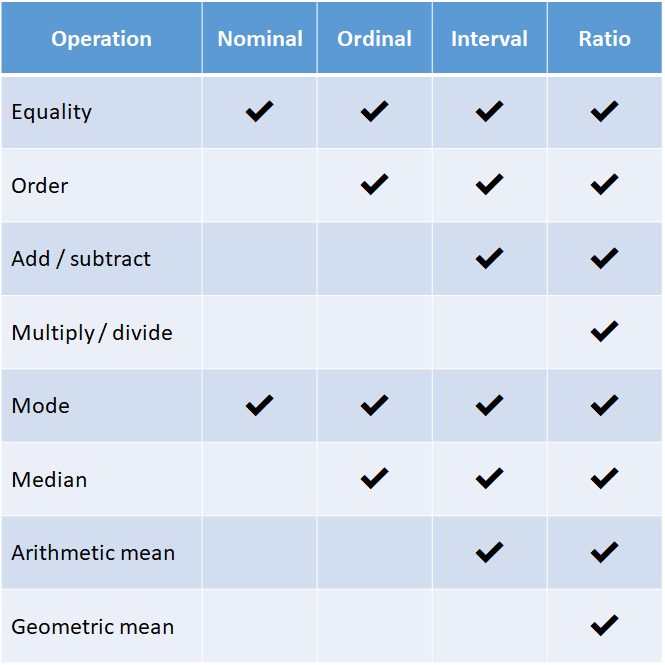
The full range of arithmetic is valid on ratio scales, making them ideal for advanced analysis. This mathematical flexibility is what sets ratio scales apart from other measurement types.
Supported Calculations
| Operation | Example | Valid on Ratio Scale? |
|---|---|---|
| Addition | 5 kg + 3 kg = 8 kg | Yes |
| Subtraction | $70k − $30k = $40k increase | Yes |
| Multiplication | 2 hours × 3 = 6 hours | Yes |
| Division | 100 miles ÷ 50 mph = 2 hours | Yes |
| Percent Change | Sales grew from $100K to $150K = +50% | Yes |
| Unit Conversion | 2 km = 2,000 m | Yes |
No other measurement scale supports all four operations safely.
Using Ratios to Compare Growth
Calculate growth factors using division. For example:
- Year 1 Sales: $200,000
- Year 2 Sales: $300,000
- Growth Factor: $300,000 ÷ $200,000 = 1.5×
This means “Sales increased by 50%” or “Sales are 1.5 times last year.” This calculation only works because revenue has a true zero.
Expert Note: Log transformations are often applied to skewed ratio data, such as income, to stabilize variance in regression models.
Analyzing Ratio Data With Statistics
Ratio scales support both descriptive and inferential statistics, offering the highest analytical precision available in measurement.
Descriptive Statistics You Can Compute
- Mean (Average): Sum divided by count. Example: average age equals 32.4 years.
- Median: Middle value, robust to outliers.
- Mode: Most frequent value.
- Standard Deviation: Measures spread around the mean.
- Variance: Square of standard deviation.
- Percentiles: Identifies top 10%, bottom 25%, and other positions.
Example: Customer ages [25, 30, 35, 40, 45] yield a mean of 35, range of 20, and standard deviation of approximately 7.9.
Choosing the Right Visualizations
Display ratio data clearly with these options:
- Histograms: Show distribution shape, such as income bands.
- Box Plots: Reveal median, quartiles, and outliers.
- Scatter Plots: Examine relationships, such as age versus spending.
- Line Graphs: Track trends over time, such as monthly sales.
Avoid pie charts for continuous ratio data because they obscure numerical precision.
Running Parametric Statistical Tests
Because ratio data meets assumptions of normality and equal intervals, you can use powerful parametric tests:
| Test | Purpose | Example |
|---|---|---|
| t-test | Compare two group means | Average spend: men versus women |
| ANOVA | Compare three or more group means | Sales by region |
| Pearson Correlation | Measure linear relationship | Age versus income strength |
| Linear Regression | Predict one variable from another | Forecast sales from ad spend |
Insight: These tests assume interval or ratio data. Using them on ordinal scales risks invalid results.
Applying Ratio Scales in Surveys and Research
Well-designed survey questions capture true ratio data, enabling precise insights that support business decisions.
Asking for Exact Numeric Responses
Use open numeric inputs for highest accuracy:
- “How many hours did you work last week?”
- “What was your total grocery spending last month?”
- “How long have you been a customer?”
These yield true ratio data with full computational flexibility.
Offering Range Options With Caution
Sometimes respondents prefer ranges, such as:
- $0
- $1–$100
- $101–$300
- $301–$600
- Over $600
While easier to answer, range data becomes ordinal-like, limiting analysis. You cannot calculate an exact mean, so use the median instead. Consider non-parametric tests for this data type.
Best Practice: Use ranges only when recall is difficult or privacy is a concern.
Avoiding Common Survey Pitfalls
Several mistakes undermine ratio data quality:
- Unclear timeframe: “How much do you spend?” is ambiguous. Fix this by asking: “In the past 30 days, how much did you spend?”
- Missing units: “How long?” requires specification, such as “minutes per day.”
- Social desirability bias: High-income earners may underreport. Use anonymous responses and neutral wording.
Pro Tip: Set numeric input fields to reject text entries and validate ranges automatically.
Using Ratio Scales in Map Reading and Cartography
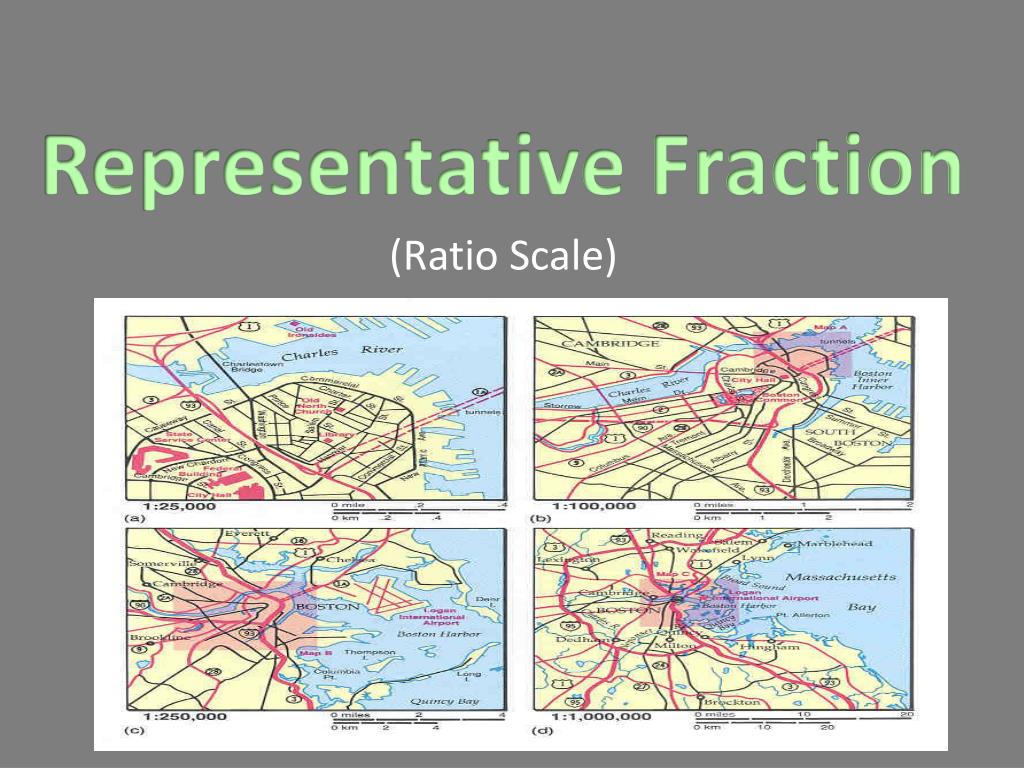
In geography, a ratio scale (or representative fraction) shows how map distances relate to real-world distances. This application demonstrates the scale’s mathematical power in practical contexts.
Interpreting 1:100,000 Map Scales
A scale of 1:100,000 means 1 unit on the map equals 100,000 of the same units in reality.
- 1 cm equals 100,000 cm, which equals 1 km.
- 1 inch equals 100,000 inches, which equals approximately 1.58 miles.
Units cancel out in the ratio, so conversions happen after calculation.
Visual Cue: Look for “1:X” notation in map legends. This is the purest form of scale expression.
Converting Map Distance to Real Distance
Follow these steps:
- Measure distance on the map in centimeters or millimeters.
- Multiply by the scale denominator.
- Convert to a practical unit, such as kilometers or miles.
Example: Scale is 1:50,000. Map distance is 6 cm.
Calculation: 6 × 50,000 = 300,000 cm. Converting: 300,000 ÷ 100,000 = 3 km. Therefore, 6 cm on the map equals 3 km in reality.
Shortcut: On 1:100,000 maps, every 1 cm equals 1 km.
Converting Real Distance to Map Distance
Follow these steps:
- Convert real distance to centimeters.
- Divide by the scale denominator.
- The result is the map length in centimeters.
Example: Scale is 1:25,000. Real distance is 2 km.
Convert: 2 km equals 200,000 cm. Divide: 200,000 ÷ 25,000 = 8 cm. Therefore, 2 km equals 8 cm on the map.
Deriving Scale From Known Distances
When scale is missing, calculate it from known measurements:
- Measure map distance, such as 4 cm.
- Know the real distance, such as 2 km.
- Convert both to the same unit in centimeters.
- Form a ratio and simplify to 1:X.
Example: Map shows 4 cm. Real distance is 2 km, which equals 200,000 cm. The ratio is 4:200,000. Dividing both by 4 yields 1:50,000.
Field Tip: Use road signs or GPS coordinates to verify distances and compute unknown scales.
Frequently Asked Questions About Ratio Scales
What makes a ratio scale different from an interval scale?
The key difference is the true zero. A ratio scale has a meaningful zero that represents the complete absence of the quantity. An interval scale, like Celsius temperature, has an arbitrary zero point. This means you can say 10 kg is twice 5 kg, but you cannot say 20°C is twice 10°C.
Can ratio scales be used for categorical data?
No. Ratio scales require numerical data where zero has real meaning. Categorical data, such as colors or brand names, uses nominal scales. If your data involves categories with a meaningful order but no true zero, use an ordinal or interval scale instead.
What are some common examples of ratio scale variables?
Common examples include age, weight, height, income, distance, time duration, speed, revenue, and number of purchases. Each of these has a true zero: zero age means not born yet, zero income means no earnings, zero purchases means no transactions.
Why is the true zero important for statistical analysis?
The true zero enables all mathematical operations, including multiplication and division. This allows meaningful proportional comparisons and supports parametric statistical tests that require interval or ratio data. Without a true zero, these operations would produce invalid results.
How do ratio scales apply to map reading?
In cartography, ratio scales appear as representative fractions, such as 1:50,000. This means one unit on the map equals 50,000 of the same units in the real world. You can convert between map distances and real distances using multiplication or division, depending on which direction you are converting.
Can ratio data be discrete or continuous?
Ratio data can be either. Continuous ratio variables, like weight or temperature, can take any value within a range. Discrete ratio variables, like the number of purchases or customers, can only take specific whole number values. Both types support the same mathematical operations.
Key Takeaways for Understanding Ratio Scales
A ratio scale works by combining equal intervals with a true zero point, enabling meaningful proportional comparisons and full mathematical operations. This makes it the most powerful measurement scale available for data analysis. Whether you are calculating customer spending, measuring physical quantities, or interpreting map distances, the true zero is what allows you to say one value is twice or half another with complete mathematical validity.
Always confirm the presence of a true zero before performing multiplication or division. Distinguish ratio data from interval, ordinal, and nominal data to choose appropriate visualizations and statistical tests. For surveys, prefer exact numeric responses over ranges when possible to maintain full analytical flexibility. In cartography, master the conversion between map and real distances by understanding how scale denominators work.
By applying these principles, you will ensure accurate data interpretation, robust statistical modeling, and informed decision-making across scientific, business, and technical domains.