If you’re tracking fitness goals, managing weight, or optimizing health, the Garmin Index S2 Smart Scale promises a seamless way to monitor body composition from your bathroom floor. But how accurate is the Garmin smart scale really? For users relying on precise data to guide training, nutrition, or medical decisions, the answer matters significantly.
This guide breaks down exactly how accurate the Garmin smart scale is across every metric it measures, compares it to clinical gold standards, reveals real-world discrepancies, and explains what you can trust. Whether you’re considering a purchase or already own one, you’ll learn how to get the most reliable insights from your device.
How the Garmin Smart Scale Measures Your Body
The Garmin Index S2 uses bioelectrical impedance analysis to estimate body composition. This technology sends a low electrical current through your body to measure how different tissues resist the flow, which helps calculate fat, muscle, and other metrics.
Understanding BIA Technology
The scale uses single-frequency, foot-to-foot bioelectrical impedance analysis. Here is how it works:
• A safe, low electrical current passes from one foot through your lower body to the other foot
• The scale measures resistance to this current, where fat tissue resists flow while muscle and water-rich tissue conduct easily
• Using this impedance value plus your age, height, gender, and activity level, the scale estimates body fat percentage, skeletal muscle mass, body water, bone mass, and visceral fat
• The current never reaches your upper body, limiting its ability to assess full-body composition accurately
Why Foot-to-Foot BIA Has Limitations
While convenient, this measurement approach has critical drawbacks:
• No upper-body measurement means the scale cannot assess arm or trunk muscle and fat distribution
• Single-frequency technology cannot distinguish between intracellular and extracellular water
• The algorithm relies on population averages rather than direct tissue measurement
• No segmental analysis breaks down composition by body region
The Garmin Index S2 provides estimates rather than direct measurements, and these should be interpreted accordingly.
Garmin vs. DEXA: Accuracy Comparison Results
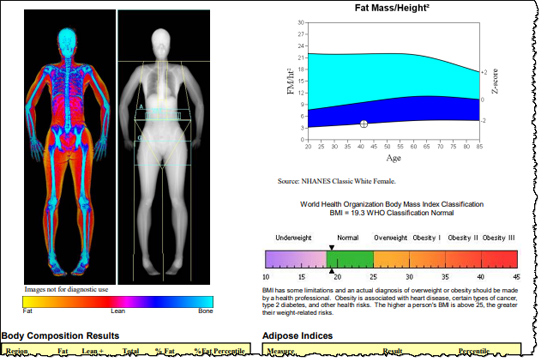
Dual-energy X-ray absorptiometry is the gold standard for body composition analysis. Understanding how Garmin compares to this clinical benchmark reveals the true accuracy of smart scale measurements.
What DEXA Scans Measure
DEXA uses low-dose X-rays to directly measure fat mass, lean muscle mass, bone mineral content, and visceral fat with over 99% accuracy. This is why clinical and research settings rely on DEXA as the benchmark for body composition analysis.
Side-by-Side Comparison Test
A direct comparison was conducted on a male user weighing 64.7 kg using a Garmin Index S2 and a GE Healthcare Lunar iDEXA scanner:
• Weight: DEXA showed 64.7 kg while Garmin showed 64.4 kg, a difference of just 0.3 kg
• Body fat percentage: DEXA measured 18.265% versus Garmin’s 14.2%, a discrepancy of over 4 percentage points
• Bone mass: DEXA measured 2.692 kg while Garmin reported 4.3 kg, an overestimation of nearly 60%
• Lean mass: DEXA showed 53.367 kg versus Garmin’s 29.7 kg, a massive underestimation
The weight measurement proved highly accurate, but body composition metrics showed significant deviations from the gold standard.
Body Composition Metrics: What You Can Trust

Not all measurements from the Garmin smart scale are equally reliable. Understanding which numbers you can trust helps you use the device effectively.
Weight and BMI: Highly Accurate
Weight measurement is the Garmin scale’s strongest metric. Tests show accuracy within 0.1 to 0.3 kg, making it reliable for tracking weight changes. BMI is also accurate since it is calculated from precise weight and your input height.
Body Fat Percentage: Trend Only
Body fat readings typically vary 4 to 9 percentage points from actual values. One user reported seeing 23.6% on Garmin compared to 14.8% on a DEXA scan done just three hours later. The scale consistently underestimates or overestimates depending on hydration, activity level, and user settings. Focus on tracking the direction of change rather than trusting the absolute number.
Bone Mass: Not Reliable
Bone mass is wildly inaccurate, with errors reaching up to 60% overestimation. The scale does not measure bone density. Instead, it estimates bone mass using predictive algorithms based on BIA and user inputs. Do not use Garmin bone mass for health monitoring or to detect conditions like osteoporosis.
Skeletal Muscle Mass: Derived and Flawed
Since muscle mass is calculated by subtracting fat and bone from total weight, errors in those inputs distort muscle readings. While useful for spotting long-term trends, the absolute number is unreliable.
Body Water and Visceral Fat: Moderate Accuracy
Body water percentage fluctuates significantly with fluid intake, exercise, and time of day. It is more useful for spotting dehydration patterns than precise tracking. Visceral fat reliability remains unknown since no DEXA comparison data exists.
Factors That Affect Garmin Scale Accuracy
Several variables influence your readings. Understanding these helps you achieve more consistent results.
User Input Settings Matter
Small setup mistakes can drastically alter results. Your activity level setting on a 1 to 20 scale has a major impact on body fat percentage readings. Setting it too high produces artificially low body fat numbers. Users report 5 to 7% body fat shifts after adjusting this setting. Use conservative activity levels such as 5 to 7 for moderate exercise rather than inflating the number for lower readings.
Measurement Conditions Influence Results
Your readings fluctuate based on several factors:
• Time of day: Morning readings are most consistent
• Hydration status: Dehydration increases fat estimates while overhydration lowers them
• Recent exercise: Alters fluid distribution and skews BIA readings
• Food and drink intake: Increases impedance and raises fat estimates
• Foot dryness: Dry skin creates higher resistance and inaccurate readings
• Barefoot requirement: Socks block the electrical current
Weigh first thing in the morning, post-bathroom, barefoot, before eating or drinking for the most consistent results.
Calibration Limitations
Garmin Connect allows manual input for body fat percentage and skeletal muscle mass. However, no option exists to manually set bone mass, body water percentage, or visceral fat. Users have requested the ability to enter DEXA-confirmed values for these metrics without success.
Garmin Index S2 vs. Other Smart Scales

How does the Garmin Index S2 compare to competing smart scales when tested against DEXA?
Accuracy Comparison
| Scale | Body Fat % vs. DEXA | Technology |
|---|---|---|
| Tanita RD-953 | -2.2 pp | Multi-frequency, hand+foot |
| Xiaomi Scale 2 | -3.2 pp | Single-frequency |
| Garmin Index S2 | -4.1 pp | Single-frequency, foot-to-foot |
| Withings Body Cardio | -7.1 pp | Multi-frequency |
Multi-frequency, segmental BIA scales like Tanita outperform Garmin due to full-body current paths and better hydration modeling. However, Garmin offers superior ecosystem integration if you already use Garmin watches and apps.
How to Use the Garmin Smart Scale Effectively
You can maximize the value of your Garmin scale by following these best practices.
Best Use: Trend Tracking
Weigh daily at the same time, ideally morning before eating. Use 7-day averages to smooth out daily fluctuations. Track photos and tape measurements alongside the data. Focus on the direction of change rather than absolute numbers.
Improving Accuracy
Calibrate body fat percentage using skinfold calipers or a DEXA scan. Set realistic activity levels and avoid inflating them for lower body fat readings. Keep feet slightly damp for consistent conductivity. Avoid weighing immediately after exercise or large meals.
Ideal Users
The Garmin Index S2 works best for Garmin ecosystem users who want automated health tracking, individuals focused on long-term trend analysis, and those seeking motivational feedback through Fitness Age and goal tracking. It is not suitable for clinical assessments, athletes needing precise data, or users expecting lab-grade accuracy.
Legal Concerns: The Class-Action Lawsuit
A lawsuit filed in May 2026 raises serious questions about Garmin’s marketing claims.
Lawsuit Details
Victor Maurer filed a class-action lawsuit in the U.S. District Court for the Northern District of Illinois. The allegations claim Garmin falsely markets the Index S2 as providing accurate body composition measurements. The lawsuit argues Garmin fails to disclose that foot-to-foot BIA cannot accurately measure body composition. The relief sought exceeds $5 million in damages and a court declaration that the device cannot accurately measure body composition.
Garmin has not publicly responded to the lawsuit as of this writing.
Final Verdict: Is the Garmin Smart Scale Worth It?
The Garmin Index S2 delivers excellent weight accuracy and strong trend-tracking capabilities, but its body composition metrics especially bone mass and body fat are often significantly off compared to clinical standards.
What Works Well
Weight measurement is accurate within 0.3 kg, making it reliable for tracking weight changes. The ecosystem integration is seamless, syncing automatically with Garmin Connect and watches. Trend visualization tools help monitor long-term progress effectively.
Where It Falls Short
Body composition metrics are estimates, not measurements, and can be off by 4 to 9 percentage points. Bone mass is overestimated by up to 60%. No manual calibration exists for key metrics like bone mass and body water. The activity level setting heavily skews results.
Bottom Line
Use the Garmin smart scale as a motivational tool for tracking trends, not a diagnostic device for measuring body composition. Focus on the direction of change over time rather than obsessing over the specific number on the screen.
Frequently Asked Questions About Garmin Smart Scale Accuracy
Does the Garmin Index S2 measure body fat accurately?
No. Body fat percentage readings typically differ from DEXA scans by 4 to 9 percentage points. The scale is useful for tracking trends over time but should not be trusted for absolute values.
How does Garmin weight accuracy compare to clinical scales?
Weight accuracy is excellent, typically within 0.1 to 0.3 kg of clinical scales and DEXA measurements. This is the most reliable metric the scale provides.
Can I calibrate my Garmin scale for better accuracy?
You can manually input body fat percentage and skeletal muscle mass in Garmin Connect using values from skinfold calipers or a DEXA scan. However, no option exists to calibrate bone mass, body water, or visceral fat.
Is the Garmin smart scale better than other consumer scales?
For body composition accuracy, multi-frequency scales like Tanita and Withings outperform Garmin. However, Garmin offers superior integration with the Garmin ecosystem, making it the better choice for existing Garmin watch users.
Should I use the Garmin scale for medical purposes?
No. The Garmin Index S2 is not suitable for clinical or medical assessments. Use DEXA, Bod Pod, or hydrostatic weighing for accurate body composition data needed for medical decisions.
Key Takeaways for Understanding Garmin Smart Scale Accuracy
The Garmin Index S2 is highly accurate for weight measurement and useful for tracking body composition trends when used consistently. However, its body fat, muscle, bone mass, and visceral fat readings should not be considered medically accurate. Weight and BMI are reliable, while body composition metrics serve best as trend indicators. For the most accurate data, calibrate using external methods and focus on long-term trends rather than daily numbers.